mirror of https://github.com/SixLabors/ImageSharp
You can not select more than 25 topics
Topics must start with a letter or number, can include dashes ('-') and can be up to 35 characters long.
|
|
7 years ago | |
|---|---|---|
| .. | ||
| ImageSharp.Sandbox46.csproj | 7 years ago | |
| Program.cs | 7 years ago | |
| README.md | 10 years ago | |
| app.config | 9 years ago | |
README.md
Purpose
This project aims to workaround certain .NET Core tooling issues in Visual Studio based developer workflow at the time of it's creation (January 2017):
- .NET Core Performance profiling is not possible neither with Visual Studio nor with JetBrains profilers
JetBrains Unit Test explorer does not work with .NET Core projects
How does it work?
- By referencing .NET 4.5 dll-s created by net45 target's of ImageSharp projects. NOTE: These are not project references!
- By including test classes (and utility classes) of the
ImageSharp.Testsproject using MSBUILD<Link> - Compiling
ImageSharp.Sandbox46should trigger the compilation of ImageSharp subprojects using a manually defined solution dependencies
How to profile unit tests
1. With Visual Studio 2015 Test Runner
- Do not build
ImageSharp.Tests - Build
ImageSharp.Sandbox46 - Use the context menu in Test Explorer
NOTE: There was no Profile test option in my VS Professional. Maybe things were messed by VS2017 RC installation. This post suggests it's necessary to own Premium or Ultimate edition of Visual Studio to profile tests.
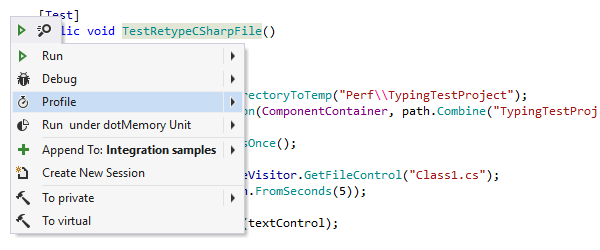
2. With JetBrains ReSharper Ultimate
- The
Sandbox46project is no longer needed here. The classicImageSharp.Testsproject can be discovered by Unit Test Explorer. - You can use context menus from your test class, or from unit Test Exporer/Unit Test Sessions windows.